5.5 Finding the rule for flow diagrams and tables
Sometimes we have information summarised and represented in a table or a flow diagram, but the rule is not
given. However, by looking at the numbers in the top row and corresponding numbers in the bottom row, we can
find the rule.
In some cases, more than one rule might be possible to describe the relationship between \(x\)- and
\(y\)-values. Any rule is acceptable if it matches all the given input values to all the corresponding output
values.
Worked Example 5.10: Finding the rule from a
flow diagram
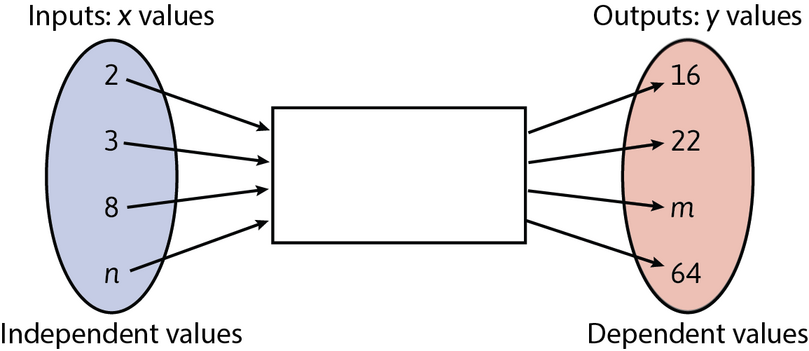
Find the rule for calculating the output value for every given input value in the flow diagram below. Use
the rule to find the missing values of \(m\) and \(n\).
Use the method of trial-and-error to find the rule. We only have two complete ordered pairs: \((2; 16)\)
and \((3; 22)\).
\[\begin{align}
2 \times 6 + 4 &= 16 \\
3 \times 6 + 4 &= 22
\end{align}\]
So, the rule could be: “multiply by \(6\) and add \(4\)”.
The method of trial-and-error is a way of finding a solution by making varied attempts until the answer
is found.
In this example, we have two complete ordered pairs: \((2;16)\) and \((3;22)\), so we need to look at
different ways to get from the first to the second number:
\(2 \times 8 = 16\), but \(3 \times 8 = 24 \neq 22\), so the rule is not “multiply by \(8\)”.
\(2 \times 5 + 6 = 16\), but \(3 \times 5 + 6 = 21 \neq 22\), so the rule is not “multiply by \(5\) and
add \(6\)”.
Keep trying!
Write the rule.
Translate the discovered relationship into a mathematical formula:
\[\begin{align}
\text{input } \times 6 + 4 &= \text{ output} \\
x \times 6 + 4 &= y
\end{align}\]
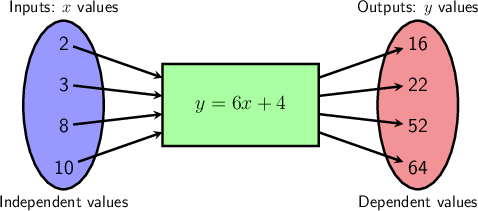
So, \(y = 6x + 4\) describes the relationship between the \(x\) values and the given \(y\) values.
Use the rule to find the missing value, \(m\).
If \(x = 8\), then:
\[\begin{align}
y &= 6(8) + 4 \\
&= 48 + 4 \\
&= 52
\end{align}\]
So, \(m = 52\).
Use the rule to find the missing value, \(n\).
If \(y = 64\), then \(64 = 6(x) + 4\).
Ask yourself, “What do I need to multiply \(6\) by to get close to \(64\)?” (\(64\) is the value on the
other side of the equal sign.)
If you multiply by \(10\), then \(6 \times 10 = 60\).
Now add \(4\):
\[6(10) + 4 = 64\]
That is the correct answer!
So, if \(y = 64\), then \(x = 10\).
\(n\) is an input value, so it is the same as this \(x\)-value.
So, \(n = 10\).
The completed flow diagram looks like this:
Worked Example 5.11: Finding the rule from a
table of values
Describe the relationship between the numbers in the top and bottom rows of the table. Then write down the
values of \(m\) and \(n\).
| \(x\) |
\(–2\) |
\(–1\) |
\(0\) |
\(1\) |
\(2\) |
|
\(12\) |
\(n\) |
| \(y\) |
\(–7\) |
\(–5\) |
\(–3\) |
\(–1\) |
\(1\) |
|
\(m\) |
\(35\) |
Find the relationship between top
and bottom numbers in the table.
Looking at the first three input values and their corresponding output values, we can find that the numbers
in the top row are doubled and then reduced by \(3\).
\[\begin{alignat}{3}
-2 \times 2 - 3 =& -4 - 3 &= -7 \\
-1 \times 2 - 3 =& -2 - 3 &= -5 \\
0 \times 2 - 3 = & 0 - 3 &= -3
\end{alignat}\]
Write the rule.
Translate the discovered relationship into mathematical formula:
\[\begin{align}
\text{input } \times 2 - 3 &= \text{ output} \\
x \times 2 - 3 &= y
\end{align}\]
So, \(y = 2x - 3\) describes the relationship between the \(x\)-values and the given \(y\)-values.
Use the rule to find the missing value of \(m\).
To find \(m\), we have to place the corresponding values for \(x\) in the rule and work out the output
value for \(y\).
If \(x = 12\), then:
\[\begin{align}
y &= 2 \times 12 - 3 \\
&= 24 - 3 \\
&= 21
\end{align}\]
So, \(m = 21\).
Use the rule to find the missing value of \(n\).
To find \(n\), we have to place the corresponding value for \(y\) in the rule and solve the equation by
inspection.
If \(y = 35\), then \(35 = 2x - 3\).
When solving the equation by inspection, we are looking for a number such that when multiplied by \(2\), is
\(3\) more than \(35\):
\[\begin{align}
19 \times 2 &= 38 \\
38 - 3 &= 35
\end{align}\]
\[\begin{align}
35 &= 2x - 3 \\
&= 2(19) - 3
\end{align}\]
So, \(n = 19\).
Test yourself now
High marks in science are the key to your success and future plans. Test yourself and learn more on Siyavula Practice.
Sign up and test yourselfExercise 5.1: Complete flow diagrams and tables
Describe the relationship between the numbers in the top and bottom rows in the table. Then write down
the values of \(m\) and \(n\).
| \(x\) |
\(–2\) |
\(–1\) |
\(0\) |
\(1\) |
\(2\) |
… |
\(6\) |
\(n\) |
| \(y\) |
\(4\) |
\(1\) |
\(0\) |
\(1\) |
\(4\) |
… |
\(m\) |
\(81\) |
\(y = x^{2}\); \(m = 36\); \(n = 9\)
Describe the relationship between the numbers in the top and bottom rows in the table. Then write down
the values of \(m\) and \(n\).
| \(x\) |
\(–2\) |
\(–1\) |
\(0\) |
\(1\) |
\(2\) |
… |
\(100\) |
\(n\) |
| \(y\) |
\(8\) |
\(9\) |
\(10\) |
\(11\) |
\(12\) |
… |
\(m\) |
\(210\) |
\(y = x + 10\); \(m = 110\); \(n = 200\)
Describe the relationship between the numbers in the top and bottom rows in the table. Then write down
the values of \(m\) and \(n\).
| \(x\) |
\(–3\) |
\(–2\) |
\(0\) |
\(2\) |
\(3\) |
… |
\(10\) |
\(n\) |
| \(y\) |
\(7\) |
\(2\) |
\(–2\) |
\(2\) |
\(7\) |
… |
\(m\) |
\(398\) |
\(y = x^{2} - 2\); \(m = 98\); \(n = 20\)
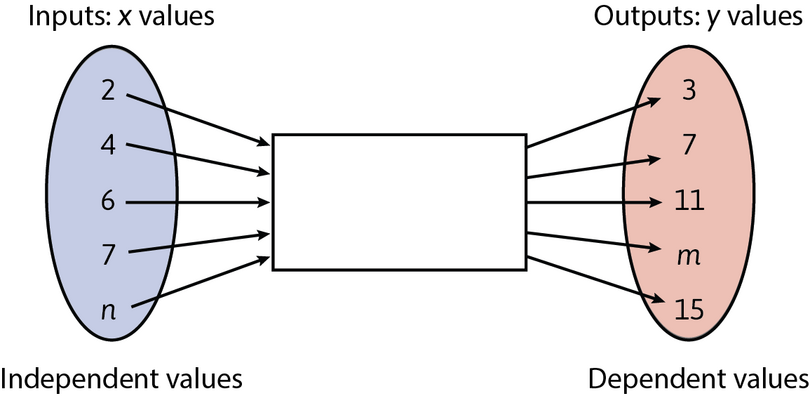
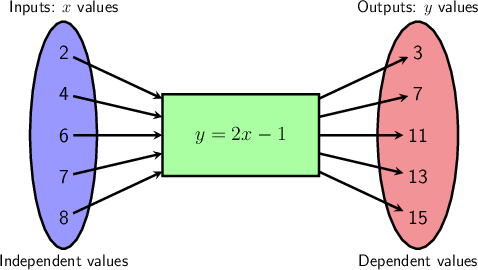
Find the rule for calculating the output value for every given input value in the flow diagram below.

Find the rule for calculating the output value for every given input value in the flow diagram below.

Find the rule for calculating the output value for every given input value in the flow diagram below. Use
the rule to calculate the values of \(m\) and \(n\).


